Tập tin:Prime number theorem ratio convergence.svg
Bước tới điều hướng
Bước tới tìm kiếm

Kích thước bản xem trước PNG này của tập tin SVG: 250×160 điểm ảnh. Độ phân giải khác: 320×205 điểm ảnh | 640×410 điểm ảnh | 1.024×655 điểm ảnh | 1.280×819 điểm ảnh | 2.560×1.638 điểm ảnh.
Tập tin gốc (tập tin SVG, 250×160 điểm ảnh trên danh nghĩa, kích thước: 87 kB)
Miêu tả
| Miêu tả |
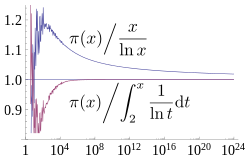
English: A plot showing how two estimates described by the prime number theorem, and converge asymptotically towards , the number of primes less than x. The x axis is and is logarithmic (labelled in evenly spaced powers of 10), going up to 1024, the largest for which is currently known. The former estimate converges extremely slowly, while the latter has visually converged on this plot by 108. Source used to generate this chart is shown below. |
| Ngày | |
| Nguồn gốc | Tác phẩm được tạo bởi người tải lên |
| Tác giả | Dcoetzee |
| SVG genesis |


Giấy phép
Tôi, người giữ bản quyền tác phẩm này, từ đây phát hành nó theo giấy phép sau:
| Tập tin này được phân phối theo Creative Commons Hiến tặng vào Phạm vi Công cộng Toàn thế giới CC0. | |
| Người nào gán tài liệu này với tác phẩm nghĩa là đã hiến tác phẩm cho phạm vi công cộng bằng cách từ bỏ mọi quyền lợi của người đó đối với tác phẩm theo quy định của luật bản quyền, có hiệu lực trên toàn thế giới và các quyền lợi pháp lý phụ mà người đó có được trong tác phẩm, đến mức độ mà luật pháp cho phép. Bạn được tự do sao chép, phân phối, và biểu diễn tác phẩm này, tất cả đều không bắt buộc ghi công.
|
Source
All source released under CC0 waiver.
Mathematica source to generate graph (which was then saved as SVG from Mathematica):
(* Sample both functions at 600 logarithmically spaced points between \
1 and 2^40 *)
base = N[E^(24 Log[10]/600)];
ratios = Table[{Round[base^x],
    N[PrimePi[Round[base^x]]/(base^x/(x*Log[base]))]}, {x, 1,
    Floor[40/Log[2, base]]}];
ratiosli =
  Table[{Round[base^x],
    N[PrimePi[
       Round[base^x]]/(LogIntegral[base^x] - LogIntegral[2])]}, {x,
    Ceiling[Log[base, 2]], Floor[40/Log[2, base]]}];
(* Supplement with larger known PrimePi values that are too large for \
Mathematica to compute *)
LargePiPrime = {{10^13, 346065536839}, {10^14, 3204941750802}, {10^15,
     29844570422669}, {10^16, 279238341033925}, {10^17,
    2623557157654233}, {10^18, 24739954287740860}, {10^19,
    234057667276344607}, {10^20, 2220819602560918840}, {10^21,
    21127269486018731928}, {10^22, 201467286689315906290}, {10^23,
    1925320391606803968923}, {10^24, 18435599767349200867866}};
ratios2 =
  Join[ratios,
   Map[{#[[1]], N[#[[2]]]/(#[[1]]/(Log[#[[1]]]))} &, LargePiPrime]];
ratiosli2 =
  Join[ratiosli,
   Map[{#[[1]], N[#[[2]]]/(LogIntegral[#[[1]]] - LogIntegral[2])} &,
    LargePiPrime]];
(* Plot with log x axis, together with the horizontal line y=1 *)
Show[LogLinearPlot[1, {x, 1, 10^24}, PlotRange -> {0.8, 1.25}],
 ListLogLinearPlot[{ratios2, ratiosli2}, Joined -> True],
 LabelStyle -> FontSize -> 14]
LaTeX source for labels:
$$ \left.{\pi(x)}\middle/{\frac{x}{\ln x}}\right. $$
$$ \left.{\pi(x)}\middle/{\int_2^x \frac{1}{\ln t} \mathrm{d}t}\right. $$
These were converted to SVG with [1] and then the graph was embedded into the resulting document in Inkscape. Axis fonts were also converted to Liberation Serif in Inkscape.
Lịch sử tập tin
Nhấn vào ngày/giờ để xem nội dung tập tin tại thời điểm đó.
| Ngày/Giờ | Hình xem trước | Kích cỡ | Thành viên | Miêu tả | |
|---|---|---|---|---|---|
| hiện tại | 14:07, ngày 21 tháng 3 năm 2013 | | 250×160 (87 kB) | wikimediacommons>Dcoetzee | Change n to x to match article |
Trang sử dụng tập tin
2 trang sau sử dụng tập tin này: